| StockFetcher Forums · Stock Picks and Trading · Intraday Alerts | << 1 ... 1387 1388 1389 1390 1391 ... 1903 >>Post Follow-up |
| Mactheriverrat 3,172 posts msg #125176 - Ignore Mactheriverrat |
9/22/2015 7:33:26 PM AMBA in that down trend still - Looks like another key support level where it's at right now give or take. If it moves up could be a uptrend in the making off a double bottom maybe. |
| karennma 8,057 posts msg #125177 - Ignore karennma |
9/22/2015 8:29:36 PM Mactheriverrat 510 posts msg #125148 - Ignore Mactheriverrat 9/22/2015 7:10:15 AM AMBA has been in down tread since 8 14 15 or there abouts =============================================== And, IMHO, it's still in a downtrend but peeps are still trading long positions anyway. I'll revisit AMBA at the bottom -- where ever that is .. hopefully sub $40. |
| karennma 8,057 posts msg #125178 - Ignore karennma |
9/22/2015 8:47:24 PM The whole market's going down the toilet, IMHO ... I will only trade the trend (lesson learned!), so at this point I'm observing other strategies, i.e., short ETFs -- maybe .... Or maybe I'll just sit this whole thing out and just watch the show. I'm perfectly happy to be in cash, as opposed to losing my retirement money. |
| johnpaulca 12,036 posts msg #125181 - Ignore johnpaulca modified |
9/22/2015 11:14:47 PM Karen or anyone....how do you decide when a stock is trending or not in your time frame? |
| johnpaulca 12,036 posts msg #125182 - Ignore johnpaulca |
9/22/2015 11:41:43 PM BF.B($99.18)....looking for a move into the booya zone. Had a similar move last week with HRC. Both stocks are trending( above BB(125,0.1,simple). BB(40,0.4,simple) is above BB(125,0.1,simple) |
| Eman93 4,750 posts msg #125183 - Ignore Eman93 |
9/23/2015 12:17:19 AM Eman93 msg #124872 9/8/2015 9:04:26 PM Looking at many many charts and running filters on the bearish 50day cross below the 200day you almost always get a rally up into resistance after the cross, most of the time its the test of the 50 or 100 day. --------------------------- The charts are on sell that is just a fact and i try to deal with facts. |
| Eman93 4,750 posts msg #125184 - Ignore Eman93 modified |
9/23/2015 12:22:56 AM Jp your trending question, On daily time frame. Trending up above 50 day, 20 day would be above 50 day. Would like to have price above the 200 day also. Making higher lows. Bear just flip it. |
| Mactheriverrat 3,172 posts msg #125185 - Ignore Mactheriverrat |
9/23/2015 4:13:30 AM Trending to me is the EMA(20) moving up from a down trend ( sort column DxD for ema(20) and the upper Bollinger band expanding day one (sort column AxA for upper bollinger band) , BxB is the lower bollinger band movement . One can change the filter to suit their needs like say EMA(20) is below EMA(20) one day ago different volume , different average day range(30) Trending up filter below Submit |
| Mactheriverrat 3,172 posts msg #125186 - Ignore Mactheriverrat |
9/23/2015 4:22:31 AM AMBA stock - first line EMA(20) trending up and upper Bollinger band moving up day one 5-14-2015 Second line EMA(20) trending down and lower Bollinger band moving down day one. 8-14-2015 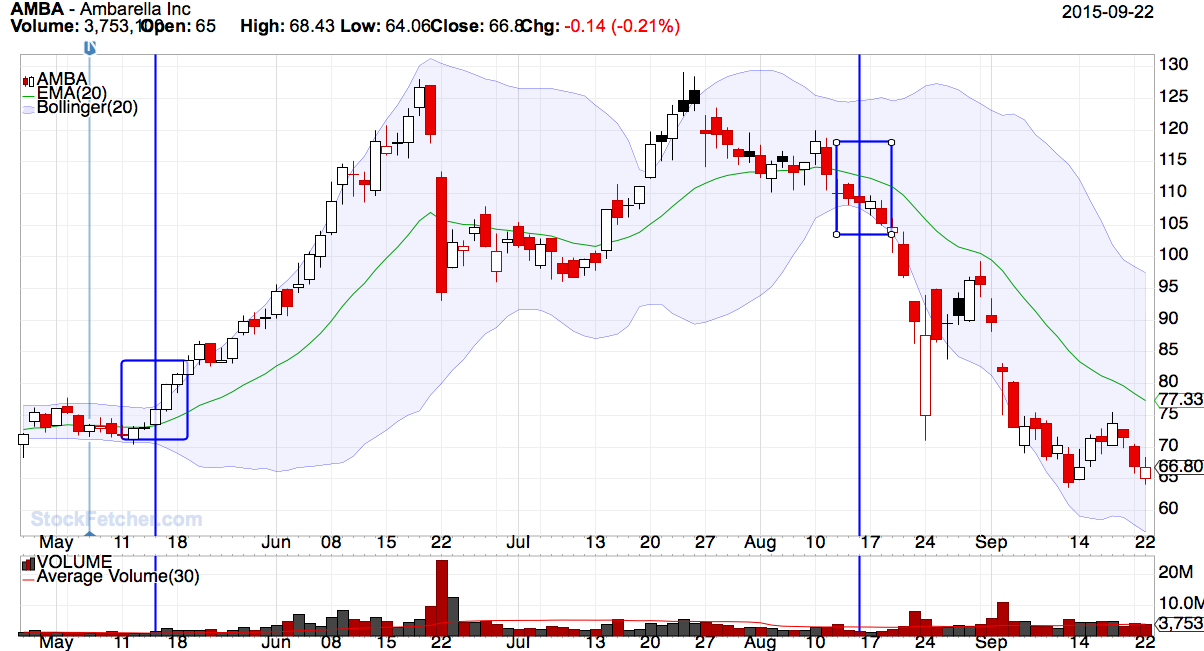 |
| karennma 8,057 posts msg #125189 - Ignore karennma |
9/23/2015 8:02:06 AM Good morning. Re: johnpaulca 9,029 posts msg #125181 - Ignore johnpaulca modified 9/22/2015 11:14:47 PM Karen or anyone....how do you decide when a stock is trending or not in your time frame? ================================================================ Just a straight line ... higher highs to higher highs, or lower lows to lower lows. Or you can use linear regression channels in any time-frame. Sorry I don't know how to post pictures of charts. (One of these days I'll figure it out. LOL!) |
| StockFetcher Forums · Stock Picks and Trading · Intraday Alerts | << 1 ... 1387 1388 1389 1390 1391 ... 1903 >>Post Follow-up |